This paper presents results from a particle-in-cell (PIC) simulation of plasma breakdown
and the approach to steady state in a low pressure, capacitive, rf argon plasma.
The PIC results are explained using a simple analytic model. The PIC simulation is
also used to study the effect of multiple pulses on plasma development in comparison
with the steady-state evolution. Results are compared qualitatively with experimental
measurements from a parallel plate rf reactor.
EXPERIMENT AND SIMULATION
Experiment
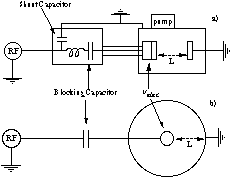
A small parallel plate reactor was used, consisting of a cylindrical aluminium vacuum vessel 30 cm in diameter and 30 cm long containing two circular electrodes. Live and earthed electrodes were of a similar diameter (~10 cm) and could both be moved to adjust the inter-electrode distance L. This is shown schematically in Figure 1 in comparison with the simulation configuration. The powered electrode
was connected to a 13.56 MHz radiofrequency power source (ENI), via an L matching network. The power source was modified to obtain rise times on the order of 100s of nanoseconds, controlled by a pulse generator. Measurements of the electrode voltage were performed using an rf probe inserted into the matching box, and axial and radial ports
were available for Langmuir probe measurements. Argon gas was flowed continuously through thesystem with the gas pressure controlled by a flow meter.

The simulation is voltage-driven with the inner electrode coupled to the rf generator through an external circuit capacitor; the outer electrode is earthed. The capacitor in the simulation models the blocking capacitor in the experimental matching network, but the rest of the match box is not explicitly represented. As a consequence the rise time of the voltage signal, which depends on the matching network and response
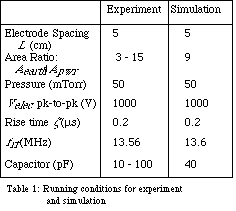
time of the rf generator, must be included empirically in the simulation. For these simulations the source voltage is given an exponential rise-time of the form

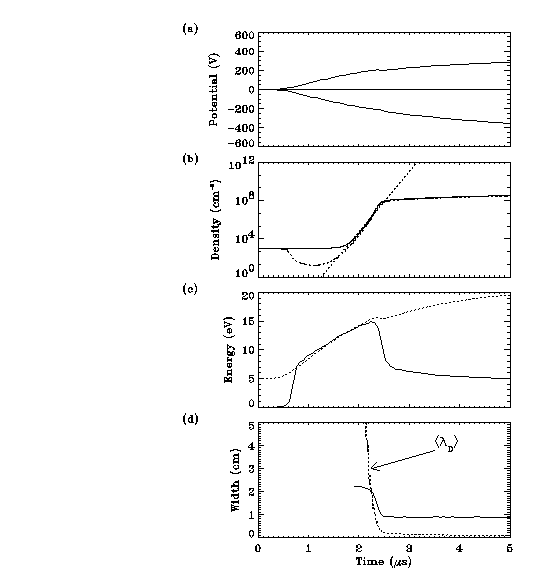
This density rise can be analytically described by considering the balance between creation of particles due to ionisation and losses to the walls, i.e,


 .
Equation (1) therefore depends on both electron temperature and density. Assuming that the dependence on temperature is small, so that an average temperature <kTe> can be used in place of
kTe(t), then equation (1) can be integrated to give
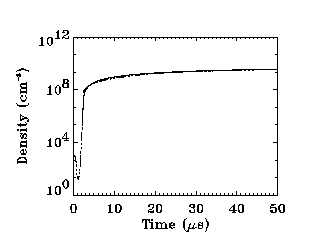
After the plasma has broken down the density rises much more slowly, since only electrons in the vicinity of the moving sheath edge can be heated. Thus only a small fraction of the electron population is capable of ionising, and the simulation shows that ionisation rate becomes approximately constant. Equation (1) can therefore be written
in the form


Technological applications involving pulsed plasmas will necessarily use multiple pulses during processing. In the case of very long off-times the plasma density will decrease to essentially zero between between pulses and so each new pulse must initiate breakdown again. However, if the off times are relatively short (on the order of ms) the plasma will not have time to completely decay away between pulses. Hence the
plasma density will experience periods of growth during the on-time of the pulse and decay when the voltage is turned off. The effect of multiple pulsing on the evolution of the plasma was simulated and the results are shown in Figure 4.
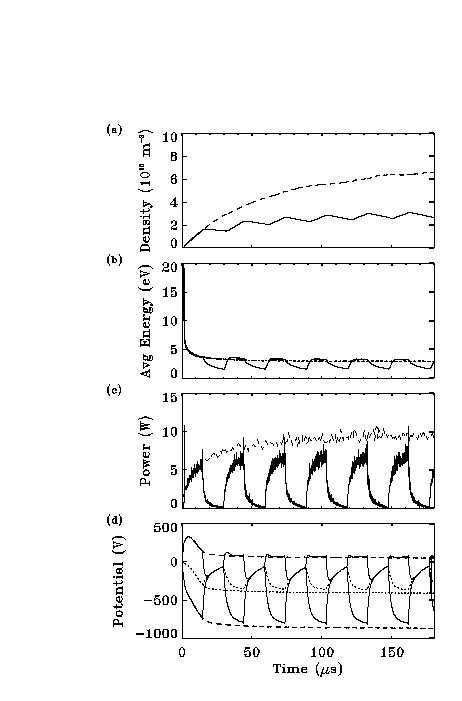
Fig. 4 Comparison of plasma evolution for multiple pulse (solid line) and single pulse (dashed line) cases. Displayed are plots of
(a) plasma density
(b) average electron energy
(c) total power
(d) rf voltage envelope and the bias voltage (dotted line).
In this case the voltage is pulsed on for 15 ms and then off for the same amount of time. The decay rate of the plasma, which is governed by the flow of ions to the electrodes, is much slower than the off period so the density decreases only slightly between on times. Note that the average density of the pulsed case is roughly half that of the non-pulsed plasma, which is not unexpected since the voltage is on only half the time. In Figure keeping with this, when the power absorbed by the plasma (Figure 4(c)) is averaged over time the value for the pulsed case is also approximately half that of the non-pulsed case.
During the first pulse the average electron energy, shown in Figure 4(b), has a very large peak (~ 20 eV) due to the penetration of the pre-breakdown fields, discussed in the previous section. Since the plasma does not substantially decay between pulses this is not repeated in subsequent pulses. However the energy during a pulse is slightly higher for the multiple pulsed case than for the steady-state system (although averaging over the whole time would give a lower energy). This is due to the exponentially increasing voltage producing increased electron heating in the oscillating sheath regions.
Examining the bias voltage, plotted as a dotted line in Figure 4 (d), it can be seen that in the multiple pulsed case it never quite reaches the value attained by the steady state system. This is due to the discharging of the circuit capacitor during the off periods of the pulse.Hence the multiply pulsed plasma is lower density, but has a higher electron temperature, reaching a smaller bias voltage and using less power.
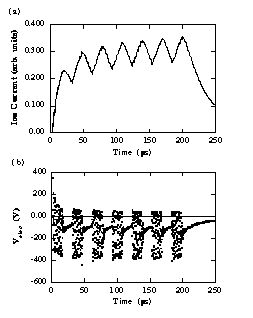
Fig. 5 Experimental measurements of a multiply pulsed
plasma showing evolution of the
(a) ion current at the centre of the plasma
(b) electrode voltage (dots) and bias voltage (dashed line).
Experimental results of multiple pulsing, again using 15 ms on and off times, are plotted in Figure 5. Figure 5(a) shows the ion current as
a function time. Assuming that the plasma is relatively undisturbed by the presence of the probe the ion current should be proportional to the plasma density through i = enub, where
n is the plasma density at the edge of the sheath surrounding the probe and ub is the Bohm velocity. The plasma density in the experiment decays somewhat faster than is seen for the simulation results. This is probably related to differences in reactor geometry between the simulation and the experiment. The decay time is linked to the diffusion rate of ions to surfaces, and the experiment contains a variety of diffusion paths including the chamber walls
as well as the electrodes. The simulation, on the other hand, is one dimensional and particles can only diffuse radially. This model is only designed to examine general aspects of plasma behaviour in asymmetric systems, rather than detailed aspects of a particular reactor.
Figure 5 (b) shows measurements of the electrode voltage overlaid with the bias voltage. These have a very similar form to the simulation results, with a small peak observed at the start of each pulse and rapid decay of the bias voltage during the time the voltage is turned off.
CONCLUSION
Before breakdown occurs electric fields can strongly penetrate the discharge, accelerating the electrons. Initially the electron density decreases until the average electron
energy reaches 10 eV. After this rapid ionisation occurs and the density increases exponentially. Once the density becomes large enough sheaths can form and the electron temperature drops to 3 eV. The density then increases in proportion to an inverse exponential until it reaches a steady state value. Analytic expressions have been derived which describe the density growth during and after breakdown.
When the rf voltage is pulsed on and off it can have a substantial effect on the plasma evolution. In general the time-averaged plasma parameters are smaller in the pulsed case, than for the steady-state system. Pulsing uses lower power than the steady-state, produces smaller bias voltages and, while the voltage is on, hotter electrons.
Improved control over the plasma can be obtained for many processing applications, by pulsing the source voltage, leading to better device fabrication.
REFERENCES
1. Ashida,, S., Lee, C. and Lieberman, M.A.,
Spatially averaged (global) model of time modulated, high density, argon plasmas,
J. Vac. Sci.Technol. A 14, 391 (1996).
2. Boswell, R.W.and Henry, D.,
Pulsed High Rate Plasma Etching with Variable Si/SiO2
Selectivityand Variable Si Etch Profiles,
Appl. Phys. Lett., 47, 1095 (1985).
3. Boswell R.W., and Porteous, R.K.,
Etching in aPulsed Plasma,
J. Appl. Phys., 62, 3123 (1987).
4. Verdeyen, J.T., Berberman, J. and Overzet, L.J.,
Modulated discharges: Effect on plasma
parameters and deposition,
J. Vac. Sci. Technol. A 8, 1851 (1990).
5. Anandan, C., Mukherjee, C., Seth, T., Dixit, P.N.and
Bhattacharyya, R.,
Effect of pulse parameters on the deposition rate of hydrogenated amorphous silicon in a modified pulsed plasma discharge,
Appl. Phys. Lett. 66, 85 (1995).
6. Trottenberg, Th., Melzer, A. and Piel, A.,
Measurement of the electric charge on
particulates forming coulomb crystals in the
sheath of a radiofrequency discharge,
Plasma Sources Sci. Technol. A 64, 450 (1995).
7. Samukawa, S. and Mieno, T.,
Pulse-time modulated plasma discharge for highly
selective, highly anisotropic and charge-free etching,
Plasma Sources Sci. Technol. 5, 132 (1996).
8. Charles, C., Boswell, R.W. and Kuwahara, H.,
SiO2 deposition from oxygen/silane pulsed helicon diffusion plasmas,
J. Appl. Phys. 67, 40 (1995)
9. Boswell, R.W. and Vender, D.,
An experimental study of breakdown in a pulsed helicon plasma,
Plasma Sources Sci. Technol., 4, 534 (1995)
10. Birdsall, C.K. and Langdon, A.B.,
Plasma Physics via Computer Simulation,
McGraw-Hill Book Co., Singapore (1985).
11. Birdsall, C.K.,
Particle-in-cell charged-particle simulations, plus Monte Carlo collisions with neutral atoms, PIC-MCC,
IEEE Trans. Plasma Sci., 19, 65 (1991).
12. Vender, D., Smith, H.B. and Boswell, R.W.,
Simulations of multipactor-assisted
breakdown in radio frequency plasmas.
J. Appl. Phys. 80, 4292 (1996)